How to Calculate Scope 1 Emissions: A Step-by-Step Guide

Why Scope 1 Matters
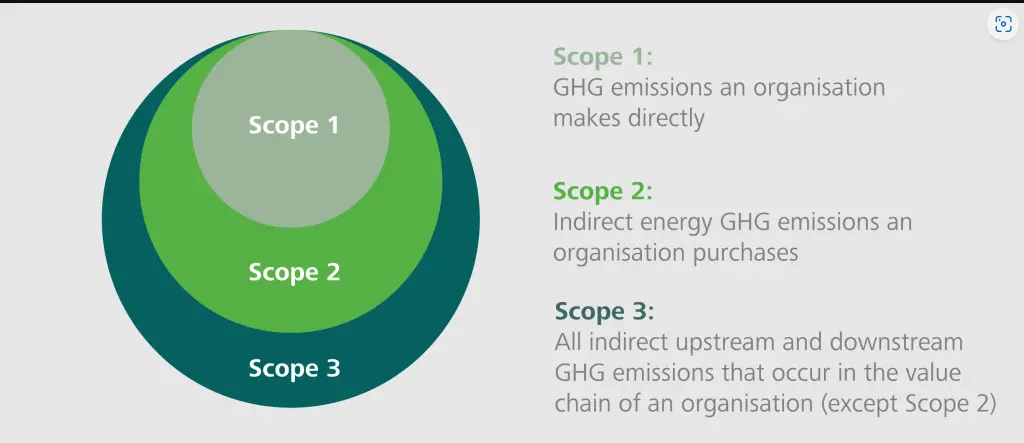
Scope 1 emissions are the direct greenhouse gases
(GHGs) released from sources your company owns or controls. They’re often
the easiest to measure and reduce, making them a critical starting point
for any carbon accounting strategy.
Examples of Scope 1 emissions are:
- Fuel
combustion in company vehicles (gasoline, diesel)
- On-site boilers,
furnaces, or generators (natural gas, coal)
- Fugitive
emissions (refrigerant leaks, methane from waste)
If your business operates vehicles, machinery, or heating
systems, you’re producing Scope 1 emissions—and regulators (like the SEC and
EU) are increasingly requiring disclosure.
Step 1: Identify Your Scope 1 Emission Sources
Compile Emissions Inventory
Before calculating Scope 1 emissions, you need a complete inventory of all direct emission sources in your operations. This "mapping" process ensures you don’t overlook significant contributors (like fugitive methane or backup generators).
|
Category |
What to Look For |
Common Examples |
|
Stationary Combustion |
Fuel burned in fixed equipment |
Boilers, furnaces, backup generators (natural gas,
diesel, coal) |
|
Mobile Combustion |
Fuel burned in vehicles/equipment you own or lease |
Company cars, delivery trucks, forklifts,
construction equipment (gasoline, diesel) |
|
Process Emissions |
GHGs released during industrial processes
(non-combustion) |
Cement production (CO₂ from limestone),
semiconductor manufacturing (PFCs) |
|
Fugitive Emissions |
Unintentional leaks of GHGs from equipment or
systems |
Refrigerant leaks (HVAC), methane from pipelines or
landfills |
Conduct a Facility Walkthrough
- Who
to involve: Facility managers, maintenance staff, fleet operators.
- What
to document: To prepare the inventory list.
- Fuel
types used (e.g., natural gas, propane, diesel).
- Equipment
lists (e.g., boiler models, vehicle registrations).
- Potential
leak points (e.g., refrigerant lines, gas valves).
Tip: Take photos and tag locations on a facility map for
reference.
Review Operational Records
Cross-check your walkthrough with:
- Fuel
purchase receipts (identify diesel, gasoline, natural gas
volumes).
- Equipment
maintenance logs (e.g., refrigerant recharge records = leaks).
- Utility
bills (e.g., natural gas consumption for heating).
Identify "Hidden" Sources
These are often missed but can be significant:
- Emergency
generators (test runs consume fuel).
- Off-road
vehicles (e.g., farm tractors, airport ground support equipment).
- Employee-owned
assets (e.g., leased vehicles under company control).
Red flag: If you operate in cold climates,
include fuel for space heating.
Use a Scope 1 Mapping Template
Create a simple spreadsheet to log sources:
|
Source Type |
Location |
Fuel/Process |
Data Source |
Notes |
|
Boiler #1 |
Main factory |
Natural gas |
Utility bills (m³) |
2,000 m³/year |
|
Delivery van (ID: 45) |
Logistics |
Diesel |
Fuel card (liters) |
5,000 L/year |
|
HVAC system |
Office building |
R-410A refrigerant |
Maintenance logs (kg) |
1.5 kg leaked last year |
Step 2:
Collect Activity Data
Collecting accurate activity data is where
carbon accounting gets real. This step transforms your mapped emission sources
(from Step 1) into quantifiable numbers.
Activity data refers to the measurable inputs that
generate emissions. Think of it as the "raw ingredients" for your
carbon calculations:
|
Emission Source |
Activity Data Needed |
Units |
Where to Find It |
|
Diesel fleet |
Liters of diesel consumed |
Liters or gallons |
Fuel cards, invoices, odometer logs |
|
Natural gas boiler |
Cubic meters (m³) of gas |
m³ or therms |
Utility bills, submeters |
|
Refrigerant leaks |
kg of refrigerant added |
kg |
HVAC maintenance records |
Golden Rule: Always track data in the same units as your emission factors (e.g., liters for diesel, kg for refrigerants).
For example:
1. Fuel Consumption (Mobile & Stationary Combustion)
- Company
Vehicles:
- Source:
Fuel purchase records, GPS fleet data, odometer readings.
- Pro
Tip: If exact data is missing, estimate using:
Fuel Used (L)=Distance Traveled (km)/Vehicle Efficiency (km/L)
*(Example: A van drives 10,000 km/year at 10 km/L → 1,000 L
diesel/year)*
- On-Site
Generators/Boilers:
- Source:
Utility bills, fuel delivery receipts, hour meters.
- Watch
For: Backup generators (often overlooked but used during outages).
2. Process Emissions (Industrial Activities)
- Data
Needed: Material inputs/outputs (e.g., limestone used in cement
production).
- Sources:
- Production
logs (e.g., "X tons of raw material consumed").
- Chemical inventories (e.g., ammonia used in refrigeration).
3. Fugitive Emissions (Leaks & Venting)
- Refrigerants:
- Source:
HVAC service records.
- No
Records?: Use default leak rates (e.g., 10% of total
charge per year).
- Methane
(Oil/Gas):
- Source:
Leak detection surveys, EPA’s GHGRP reports.
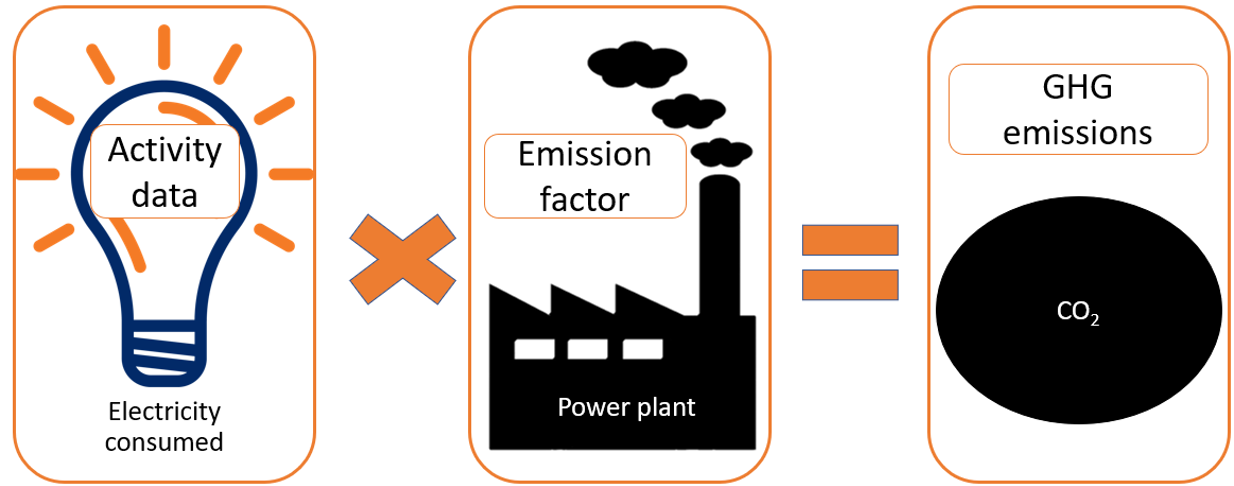
With activity data in hand, you’re ready for Step 3: Applying Emission Factors—where we turn liters and kWh into CO₂e.
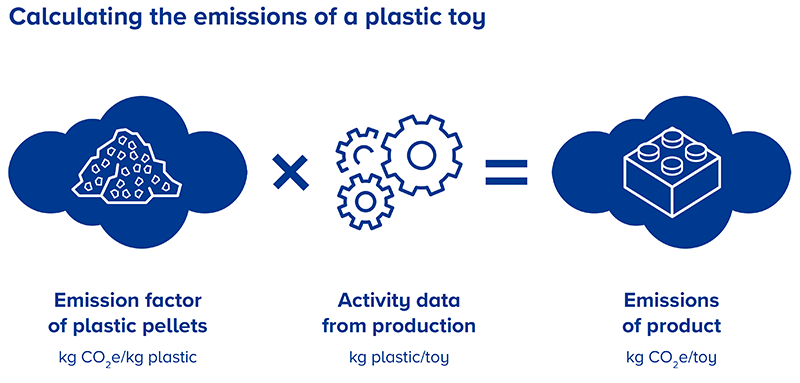
Step 3:
Apply Emission Factors
An emission factor (EF) is a standardized
value that tells you:
"How much greenhouse gas is released per unit of
activity?"
Think of it like a nutrition label for carbon:
- 1
gallon of gasoline = 8.89 kg CO₂e (like "1 cookie = 200
calories")
- 1
kWh of grid electricity = 0.5 kg CO₂e (varies by energy source)
- Government
Agencies
- EPA
(U.S.): GHG Emission Factors Hub
- DEFRA
(UK): Conversion Factors Database
- International
Organizations
- IPCC
(UN): Default factors in their Guidelines
- IEA:
Fuel-specific factors for energy
Example Calculation: Diesel-Powered Fleet
- Activity
Data: 10,000 liters of diesel consumed
- Emission
Factor (EPA): 2.68 kg CO₂e per liter
- Total
Emissions:
10,000 L×2.68 kg CO₂e/L = 26,800 kg CO₂e (26.8 metric tons)
Note: If using biofuels, adjust for biogenic CO₂
(often counted as carbon-neutral).
Step 4: Account for Fugitive Emissions
Fugitive emissions are unintentional greenhouse gas
leaks from equipment, pipelines, or industrial processes. Unlike
combustion (which releases CO₂ predictably), fugitives escape
unexpectedly—often as potent gases like methane (CH₄) or refrigerants,
which can be hundreds to thousands of times worse for global
warming than CO₂.
Key Characteristics of Fugitive Emissions
|
Feature |
Why It Matters |
|
Unintentional |
Not from burning fuel, but from leaks, evaporation, or
faulty equipment |
|
High Global Warming Potential (GWP) |
Methane = 28x CO₂; some refrigerants = 3,000–14,000x
CO₂ |
|
Often Overlooked |
Hard to detect without sensors, but can dominate your
carbon footprint |

Common Sources of Fugitive Emissions
- Refrigerants (AC
units, freezers)
- Gases:
HFCs (R-404A), CFCs, HCFCs
- GWP:
Up to 3,922x CO₂ (for R-404A)
- Oil
& Gas Systems
- Methane
leaks from pipelines, valves, fracking
- GWP:
Methane = 28x CO₂ over 100 years (but 84x over 20 years!)
- Landfills
- Decomposing
organic waste → methane
- Industrial
Processes
- Chemical
manufacturing, mining (venting of gases)
Often overlooked, fugitive emissions (e.g., refrigerants) can have high global warming potential (GWP).
How to Calculate Fugitive Emissions (Pre-Example Primer)
The formula adjusts for gas type and leak
rate:
Fugitive Emissions (kg CO₂e) = Leak Amount (kg)×GWP
Variables:
- Leak
Amount: Measured via:
- Maintenance
records (e.g., "Added 5 kg refrigerant this year")
- Infrared
cameras or sensors (for methane)
- GWP:
From IPCC or EPA tables (e.g., R-134a = 1,430x CO₂)
Example Calculation (Refrigerant Leak)
(This sets up your later detailed calculation.)
Scenario: A grocery store’s walk-in freezer
uses R-404A refrigerant.
- Leak
Detected: 3 kg lost over a year
- GWP
of R-404A: 3,922 (from IPCC)
- Calculation:
3 kg×3,922 = 11,766 kg CO₂e
Equivalent to driving a gas car 30,000
miles!
Step 5:
Sum All Sources for Total Scope 1 Emissions
Now that you’ve calculated emissions for each individual
source (e.g., vehicles, boilers, refrigerant leaks), it’s time to roll
them up into your total Scope 1 footprint. This is where your carbon
accounting comes together—but accuracy is critical.
Create a master table compiling all calculated emissions. Use this structure:
|
Emission Source |
Activity Data |
Emission Factor |
Emissions (kg CO₂e) |
|
Diesel fleet (10,000 L) |
10,000 L diesel |
2.68 kg CO₂e/L |
26,800 |
|
Natural gas boiler (5,000 m³) |
5,000 m³ natural gas |
1.96 kg CO₂e/m³ |
9,800 |
|
Refrigerant leak (R-404A) |
2 kg leaked |
GWP = 3,922 |
7,844 |
|
Total Scope 1 Emissions |
44,444 kg CO₂e |
Note: Always include units (kg CO₂e or metric tons CO₂e)
for clarity.
Take note of common mistakes before finalizing:
- Double-counting:
Did you account for the same fuel in both mobile and stationary
combustion?
- Unit
mismatches: e.g., mixing liters and gallons, or kg and tons.
- Missing
sources: Did you include backup generators, off-road equipment, or
fugitives?
Quick Audit Tip:
Compare your total to previous years or industry
benchmarks. If your emissions seem abnormally high/low, revisit
calculations.
Conclusion: Why Mastering Scope 1 Emissions Matters
Calculating your Scope 1 emissions isn’t just a compliance
exercise—it’s the foundation for credible climate action. By
following this step-by-step guide, you’ve learned how to:
- Map all
direct emission sources (from boilers to refrigerant leaks).
- Collect precise
activity data (no more guesswork).
- Apply scientifically
validated emission factors.
- Sum your
total footprint accurately—avoiding costly oversights.
As the old adage goes:
“What gets measured gets managed.”
Now that you’ve measured, it’s time to act. Stay tuned for
our next guide on Scope 2 emissions—where we’ll tackle the hidden footprint in
your electricity bill.


Comments
Post a Comment