How to Calculate Scope 2 Emissions: A Step-by-Step Guide to Indirect Energy Emissions

Why Scope 2 Matters
Scope 2 emissions are the indirect greenhouse gases (GHGs) generated
from the production of purchased electricity, steam, heating, or cooling used
by your organization. While these emissions occur at utility plants (not your
facility), they’re a critical part of your carbon footprint—and often the easiest
to reduce through clean energy procurement.
Examples of Scope 2 emissions:
- Electricity
from the grid (coal, natural gas, etc.)
- District
heating/cooling systems
- Purchased
steam
If your business pays an electricity bill, you have Scope 2 emissions—and investors, regulators, and customers are increasingly demanding transparency.
Step 1: Understand the Two Calculation Methods
Calculating Scope 2 emissions requires choosing between two fundamentally different approaches—location-based and market-based—each with distinct implications for transparency, compliance, and sustainability claims.
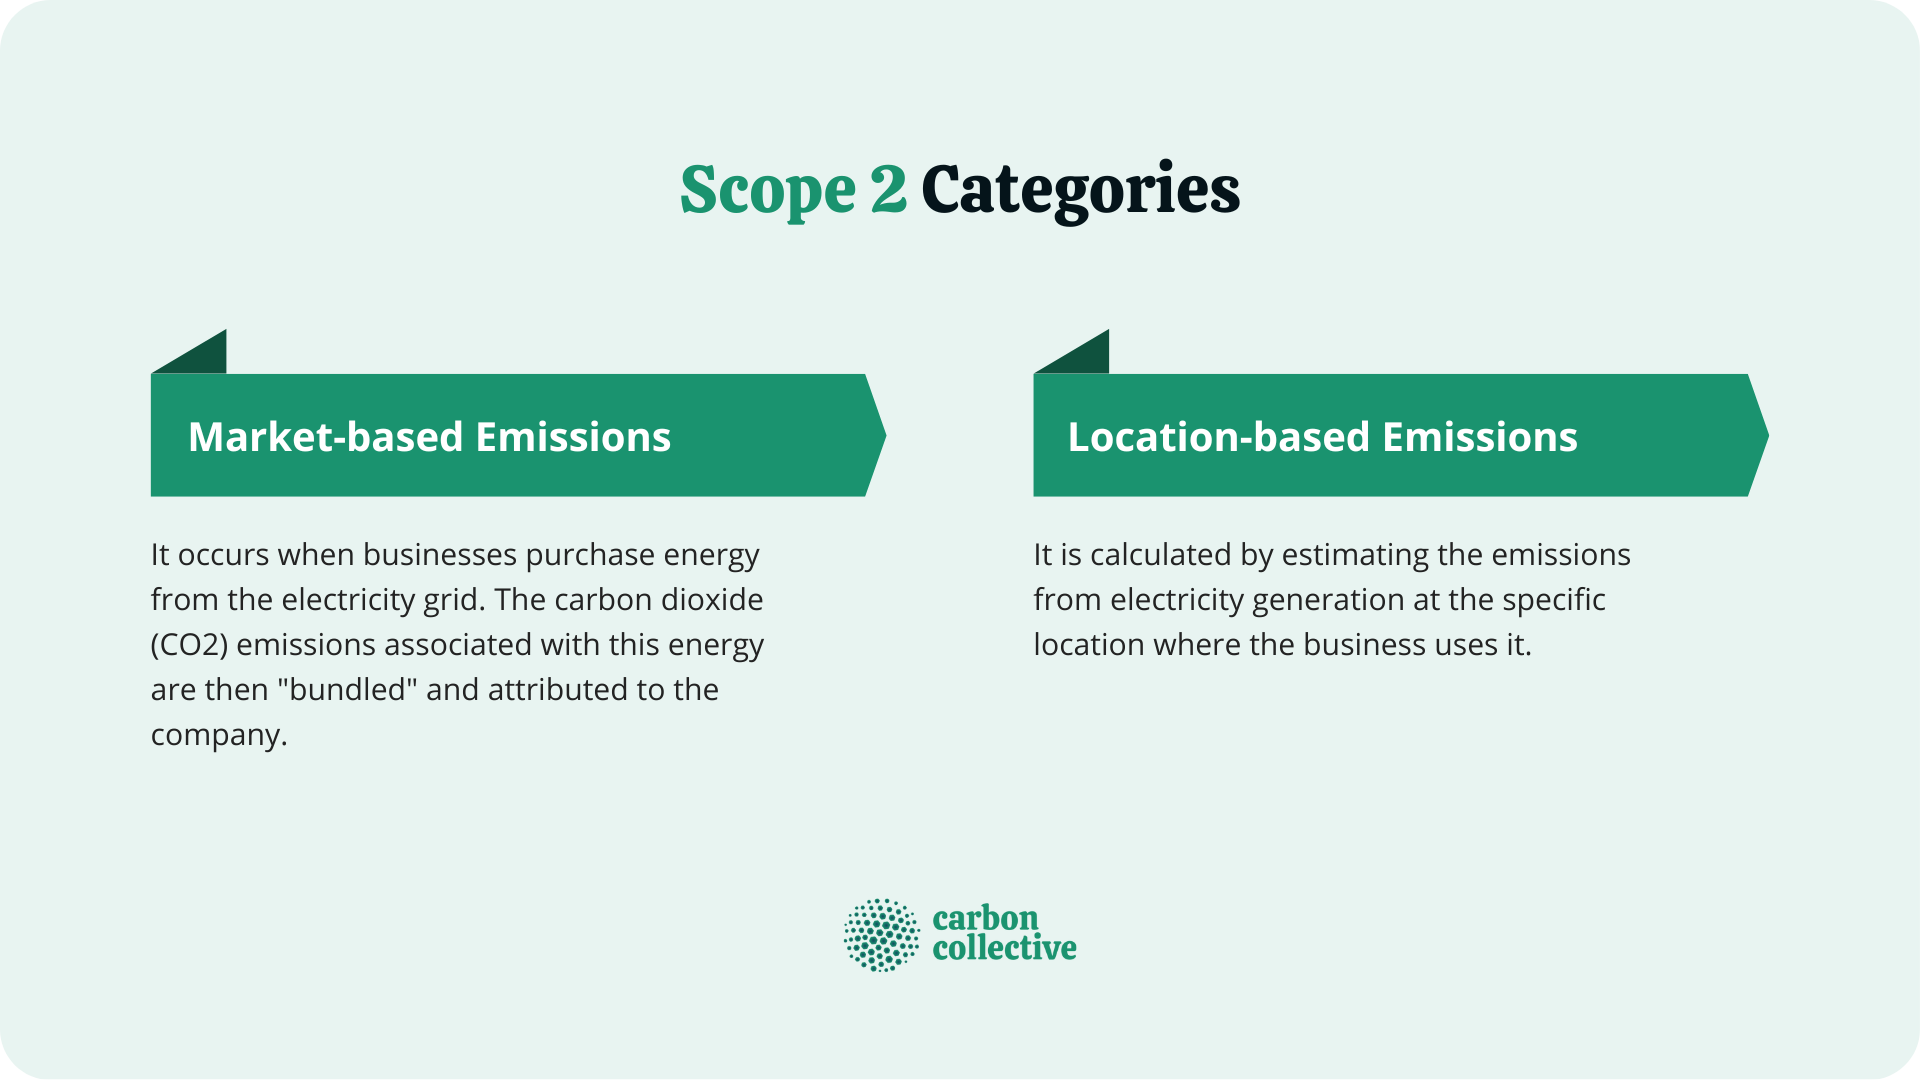
Here’s a detailed breakdown:
1. Location-Based Method
What It Measures
The average carbon intensity of the local grid where
your energy is consumed. This reflects the mix of coal, gas, renewables, and
other sources powering your region.
How It Works
- Data
Needed: Your total energy consumption (kWh).
- Emission
Factor Source: Grid averages from:
- U.S.: EPA’s eGRID (e.g.,
0.385 kg CO₂e/kWh for the U.S. grid in 2023).
- Europe: ENTSO-E or
national agencies.
- Global: IEA or IPCC defaults.
Example Calculation
If your Texas office uses 100,000 kWh/year and the
local grid factor is 0.45 kg CO₂e/kWh:
100,000 kWh × 0.45 kg CO₂e/kWh = 45,000 kg CO₂e (45 metric tons)
Pros & Cons
|
Pros |
Cons |
|
✅ Simple, standardized |
❌ Doesn’t reflect clean energy
purchases |
|
✅ Required for many regulations |
❌ May overstate footprint if
using renewables |
|
✅ Useful for regional comparisons |
❌ No incentive for green
procurement |
2. Market-Based Method
What It Measures
Emissions based on what you specifically purchased (e.g.,
renewables, Renewables Energy Certificates (RECs) or supplier contracts). This
reflects your actual energy choices.
How It Works
- Data
Needed: Energy consumption + proof of clean energy purchases (e.g., RECs,
PPAs).
- Emission
Factor Source:
- RECs/Power
Purchase Agreements (PPAs): 0 kg CO₂e/kWh (if 100% renewable).
- Utility
Green Programs: Supplier-provided factors (e.g., 0.1 kg CO₂e/kWh for a
"50% wind" plan).
Example Calculation:
Same 100,000 kWh/year usage, but you bought wind
RECs (0 kg CO₂e/kWh):
100,000 kWh×0 kg CO₂e/kWh = 0 kg CO₂e
*Note: If only 50% of your energy is covered by RECs,
calculate the remaining 50% using the location-based factor.*
Pros & Cons
|
Pros |
Cons |
|
✅ Rewards clean energy buyers |
❌ Requires detailed tracking
(RECs, contracts) |
|
✅ Aligns with corporate
sustainability goals |
❌ Not accepted by all regulators
(e.g., some require location-based) |
|
✅ Can show "zero"
emissions with 100% renewables |
❌ Risk of double-counting RECs if
not retired properly |
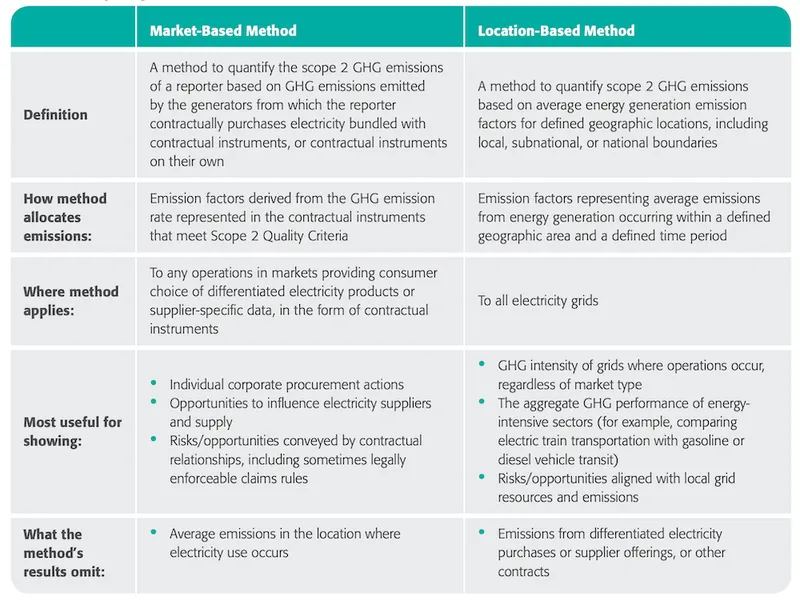
Key Differences at a Glance
|
Aspect |
Location-Based |
Market-Based |
|
Emission Factors |
Grid average |
Your specific energy purchases |
|
Transparency |
Shows regional impact |
Shows procurement efforts |
|
Regulatory Use |
Often mandatory (e.g., EU CSRD) |
Optional for claims (e.g., RE100) |
|
Best For |
Compliance, baselines |
Sustainability branding |
Why the GHG Protocol Requires Both
- Location-Based:
Ensures comparability across regions.
- Market-Based:
Incentivizes clean energy investments.
Example: Microsoft reports both:
- Location-based:
4.1 million tCO₂e (2023)
- Market-based:
0 tCO₂e (due to 100% renewables)
How to Choose for Your Business
- For
Compliance: Use location-based (required by SEC, EU).
- For
Sustainability Claims: Use market-based (e.g., "100%
renewable" reports).
- For
Investors: Report both (GHG Protocol best practice).
Step 2: Collect Your Energy Data
To accurately calculate Scope 2 emissions, you need granular
energy consumption data. This step explains how to gather and validate this
information for electricity, heating, cooling, and steam.
Gather 12 months of energy consumption in kilowatt-hours (kWh) from:
- Electricity (main
grid, renewable contracts)
- District
heating/cooling (steam, hot water, chilled water)
- Purchased
steam (common in industrial facilities)
*Exclude on-site generation (e.g., rooftop solar) – those are Scope 1 if you own the equipment.*
|
Source |
How
to Access |
Data
Needed |
|
Utility
Bills |
PDFs
from your provider or online portals |
kWh
usage per meter, billing period |
|
Smart
Meters |
Real-time
data via AMI (Advanced Metering Infrastructure) |
Hourly/daily
kWh data |
|
Energy
Management Systems (e.g.,
Siemens Navigator, Schneider Electric) |
Automated
dashboards |
Monthly/yearly
totals |
|
Submetering |
For
large facilities with multiple meters |
Breakdown
by department/floor |
Key Details to Capture
- Meter
numbers (to avoid double-counting)
- Billing
periods (align with reporting year)
- Tariff
types (e.g., time-of-use rates may affect emission factors)
Example:
*"Facility A, Meter #12345: Jan-Dec 2023 = 250,000 kWh
|
Energy Type |
Where to Find Data |
Example |
|
Electricity |
Utility bills, smart meters, energy dashboards |
*500,000 kWh/year* |
|
District heating |
Building management systems |
*1,200 GJ/year* |
|
Purchased steam |
Supplier invoices |
*800 tons/year* |
⚠️ Critical Checks:
- Ensure
units match emission factors (e.g., kWh for electricity, GJ for heat).
- Exclude on-site
generation (e.g., solar panels)—those are Scope 1!
Unit Conversions
- 1
GJ = 0.278 MWh (for alignment with electricity)
- 1
ton of steam ≈ 2.78 GJ (varies by pressure/temperature)
Example:
*"District heating: 1,200 GJ/year = 333 MWh/year"*
Create a Master Dataset
Use a spreadsheet or carbon accounting software to log:
|
Facility |
Meter ID |
Energy Type |
Usage (kWh/GJ) |
Billing Period |
Data Source |
|
HQ Building |
ELEC-789 |
Electricity |
500,000 kWh |
Jan-Dec 2023 |
Utility bill |
|
Factory |
STEAM-101 |
Purchased steam |
800 tons |
Jan-Dec 2023 |
Supplier invoice |
Check for Gaps & Errors
- Missing
meters: Ensure all facilities/submeters are included.
- Unit mismatches: Convert all data to kWh or GJ for consistency.
- Time alignment: Fiscal vs. calendar year discrepancies
Key Takeaways
- Gather
12 months of data for all meters/facilities.
- Standardize
units (kWh/GJ) early to avoid rework.
- Document
sources for auditors (e.g., utility bills, RECs).
Next: With clean data, proceed to Step 3: Apply
Emission Factors.
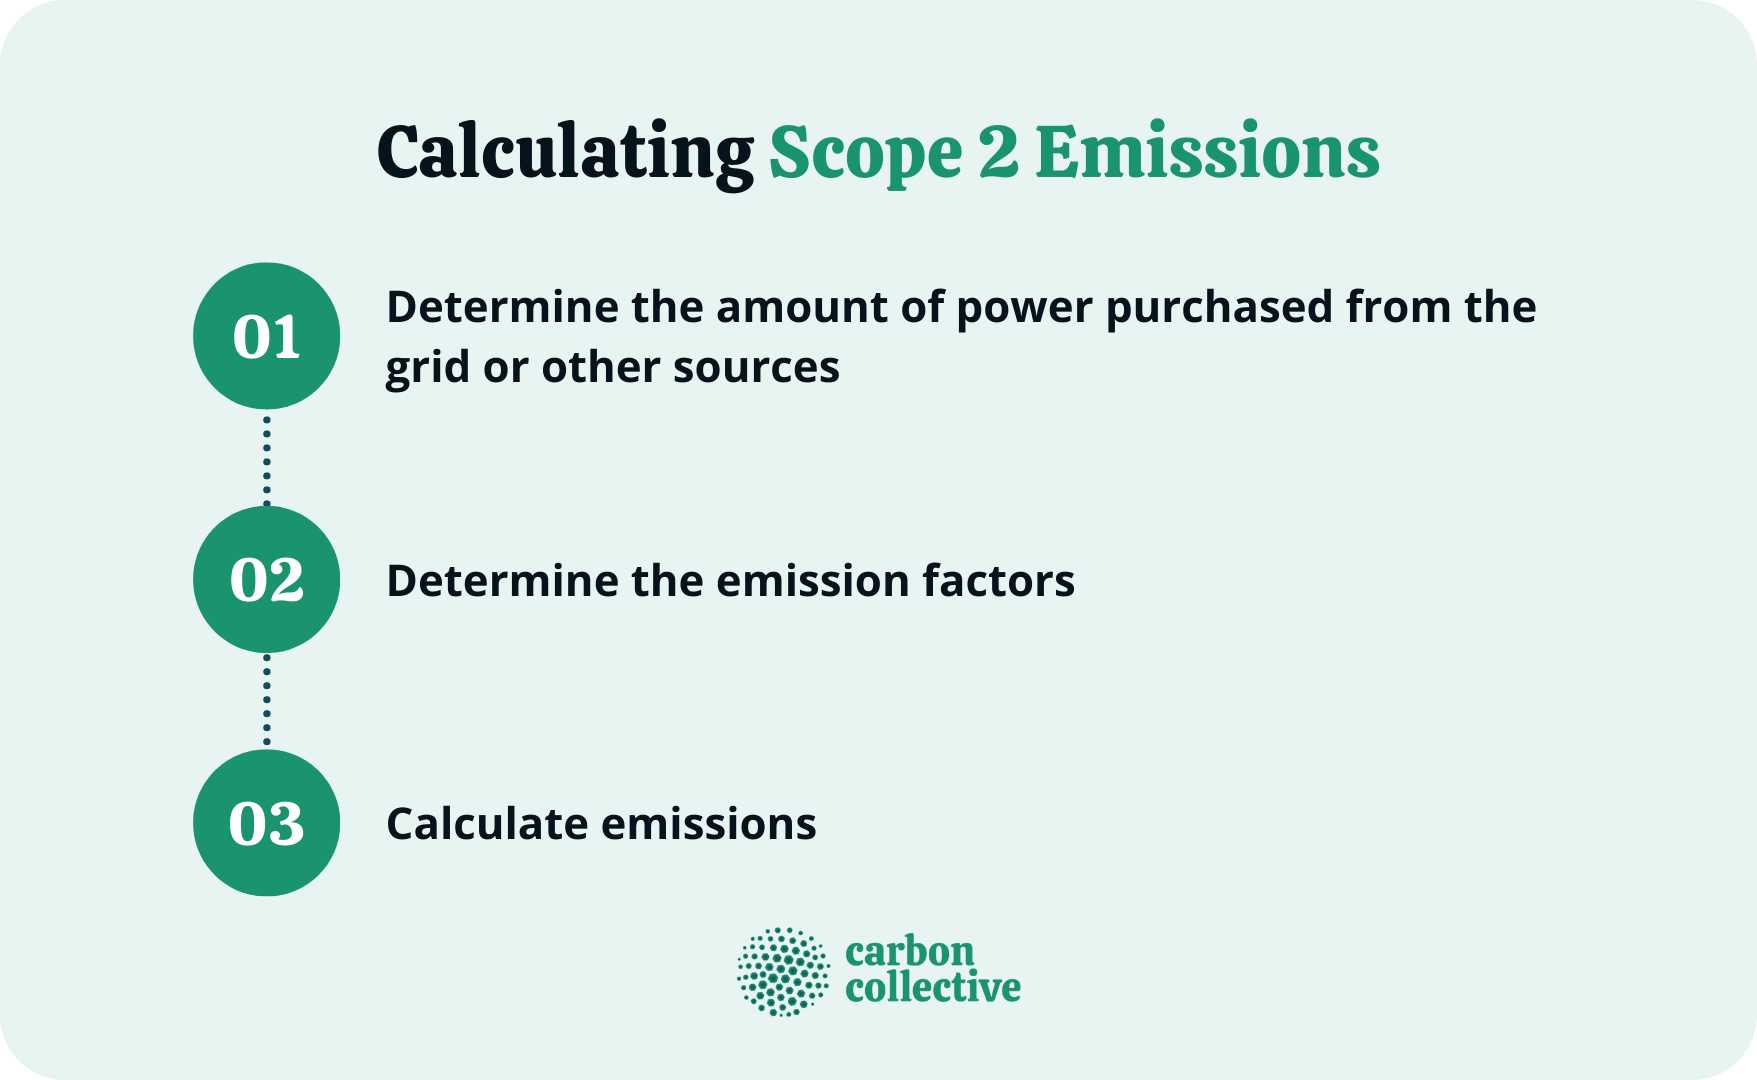
Step 3:
Find Emission Factors
Emission factors (EFs) convert your energy usage (kWh, GJ,
etc.) into CO₂ equivalents (CO₂e). Choosing the right factors is critical for
accurate Scope 2 reporting. Here’s how to do it systematically.
Location-Based Method
These reflect the average carbon intensity of your
local grid.
Use grid-average factors from:
- U.S.: eGRID (EPA)
- Europe: European Environment
Agency
- Global: IEA Country Profiles
*Example (U.S. grid avg.): 0.385 kg CO₂e/kWh*
Market-Based Method
These reflect your actual energy purchases (e.g.,
renewables, RECs).
Use factors from:
- Renewable
Energy Certificates (RECs)
- Power
Purchase Agreements (PPAs)
- Utility
green power programs
*Example: Wind power PPA = 0.01 kg CO₂e/kWh*
Real-World Example: Microsoft’s Approach
- Location-based:
Uses eGRID subregional factors for all facilities.
- Market-based:
Applies 0 kg CO₂e/kWh to 100% of usage (due to PPAs +
RECs).
- Discloses
both in sustainability reports for transparency.
Step 4: Calculate Emissions
Now that you've gathered energy data and emission factors,
it's time to crunch the numbers. This step transforms raw data into actionable
carbon metrics.
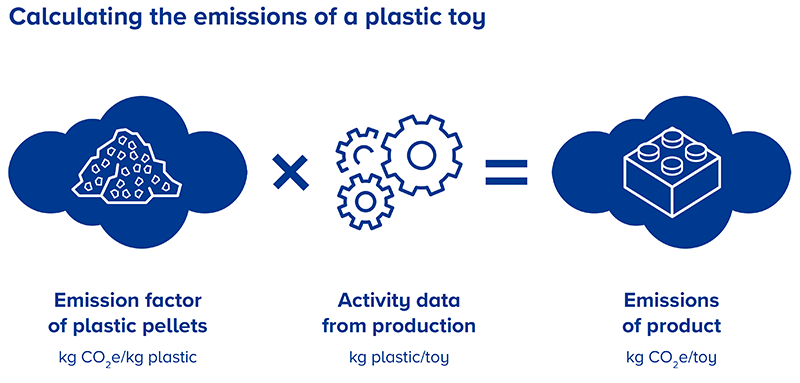
The Core Calculation Formula
For each energy type, use this basic formula:
Emissions (kg CO₂e) = Energy Consumed × Emission Factor
Location-Based Example
Emissions=Energy Used×Grid Factor
- Data:
500,000 kWh electricity × 0.385 kg CO₂e/kWh
- Total:
192,500 kg CO₂e (192.5 metric tons)
Market-Based Example
Same energy use, but with a wind PPA:
- 500,000
kWh × 0.01 kg CO₂e/kWh = 5,000 kg CO₂e (5 metric tons)
Note: The huge difference shows why
clean energy procurement matters!
For enterprises with global operations:
- Calculate
emissions per facility using local factors
- Sum
all facilities for total Scope 2
- Disclose
breakdown (helps identify high-impact regions)
Example Template:
|
Facility |
Energy (kWh) |
EF |
Emissions (tCO₂e) |
|
Texas Plant |
500,000 |
0.45 |
225 |
|
Germany HQ |
200,000 |
0.35 |
70 |
|
Total |
700,000 |
- |
295 |
Real-World Case Study: Apple's Approach
- Collects
data from 500+ facilities worldwide
- Uses
location-based for compliance (e.g., 0.35 kg CO₂e/kWh in California)
- Applies
market-based for sustainability claims (0 kg CO₂e/kWh via PPAs)
- Publicly
discloses both methods in Environmental
Progress Report
Step 5: Report Both Methods (GHG Protocol Best Practice)
The GHG Protocol requires reporting both location-based
and market-based Scope 2 emissions for full transparency. Here's why and
how to do it effectively, with real-world examples.
Why Report Both Methods?
|
Method |
Purpose |
Stakeholders Who Care |
|
Location-Based |
Shows your footprint based on local grid cleanliness
(comparability) |
Regulators, scientists, NGOs |
|
Market-Based |
Demonstrates your clean energy procurement efforts
(leadership) |
Investors, customers, ESG ra |
How to Report: Template & Examples
Basic Disclosure Format:
**2023 Scope 2 Emissions**
- Location-based: 45 tCO₂e (100,000 kWh × 0.45 kg/kWh)
- Market-based: 5 tCO₂e (80% covered by RECs at 0 kg/kWh +
20% grid at 0.45 kg/kWh)
Microsoft's 2023 Disclosure (Abbreviated):
*"Our global Scope 2 emissions:
- Location-based:
4.1 million metric tons CO₂e
- Market-based:
0 metric tons CO₂e (due to 100% renewable energy procurement via PPAs and
RECs).
The difference reflects our investment in new wind and
solar projects worldwide."
(Source: Microsoft Sustainability Report 2023)
Best Practice: Break down by region where factors
vary significantly.
Example:
|
Region |
Location-Based |
Market-Based |
|
U.S. |
800 tCO₂e |
200 tCO₂e |
|
Germany |
300 tCO₂e |
0 tCO₂e (100% RE) |
|
Total |
1,100 tCO₂e |
200 tCO₂e |
Calculating Scope 2 emissions isn’t just about
compliance—it’s a strategic opportunity to reduce costs,
enhance transparency, and demonstrate leadership in the clean energy
transition. By following this guide, you’ve learned how to:
- Choose
the right method (location-based for comparability, market-based
for clean energy claims).
- Gather
accurate data (from utility bills, RECs, and supplier contracts).
- Apply
precise emission factors (grid averages or supplier-specific
values).
- Calculate
and report transparently (meeting GHG Protocol standards).
Your Next Steps
- Start
small: Focus on your largest electricity loads first.
- Engage
suppliers: Ask utilities about green tariffs or REC options.
- Set
targets: Align with the Science-Based Targets initiative
(SBTi) for maximum impact.
Remember: Scope 2 is the easiest emissions
category to reduce. With the right data and strategy, you can turn energy
procurement into a climate solution.


Comments
Post a Comment