How to Calculate Scope 3 Emissions: A Step-by-Step Guide for Beginners

Why Scope 3 Matters
Scope 3 emissions are the hidden carbon
footprint in your value chain—everything from the coffee beans your office
buys to the flights your employees take. They often make up 70-90% of a
company’s total emissions, yet most businesses ignore them.
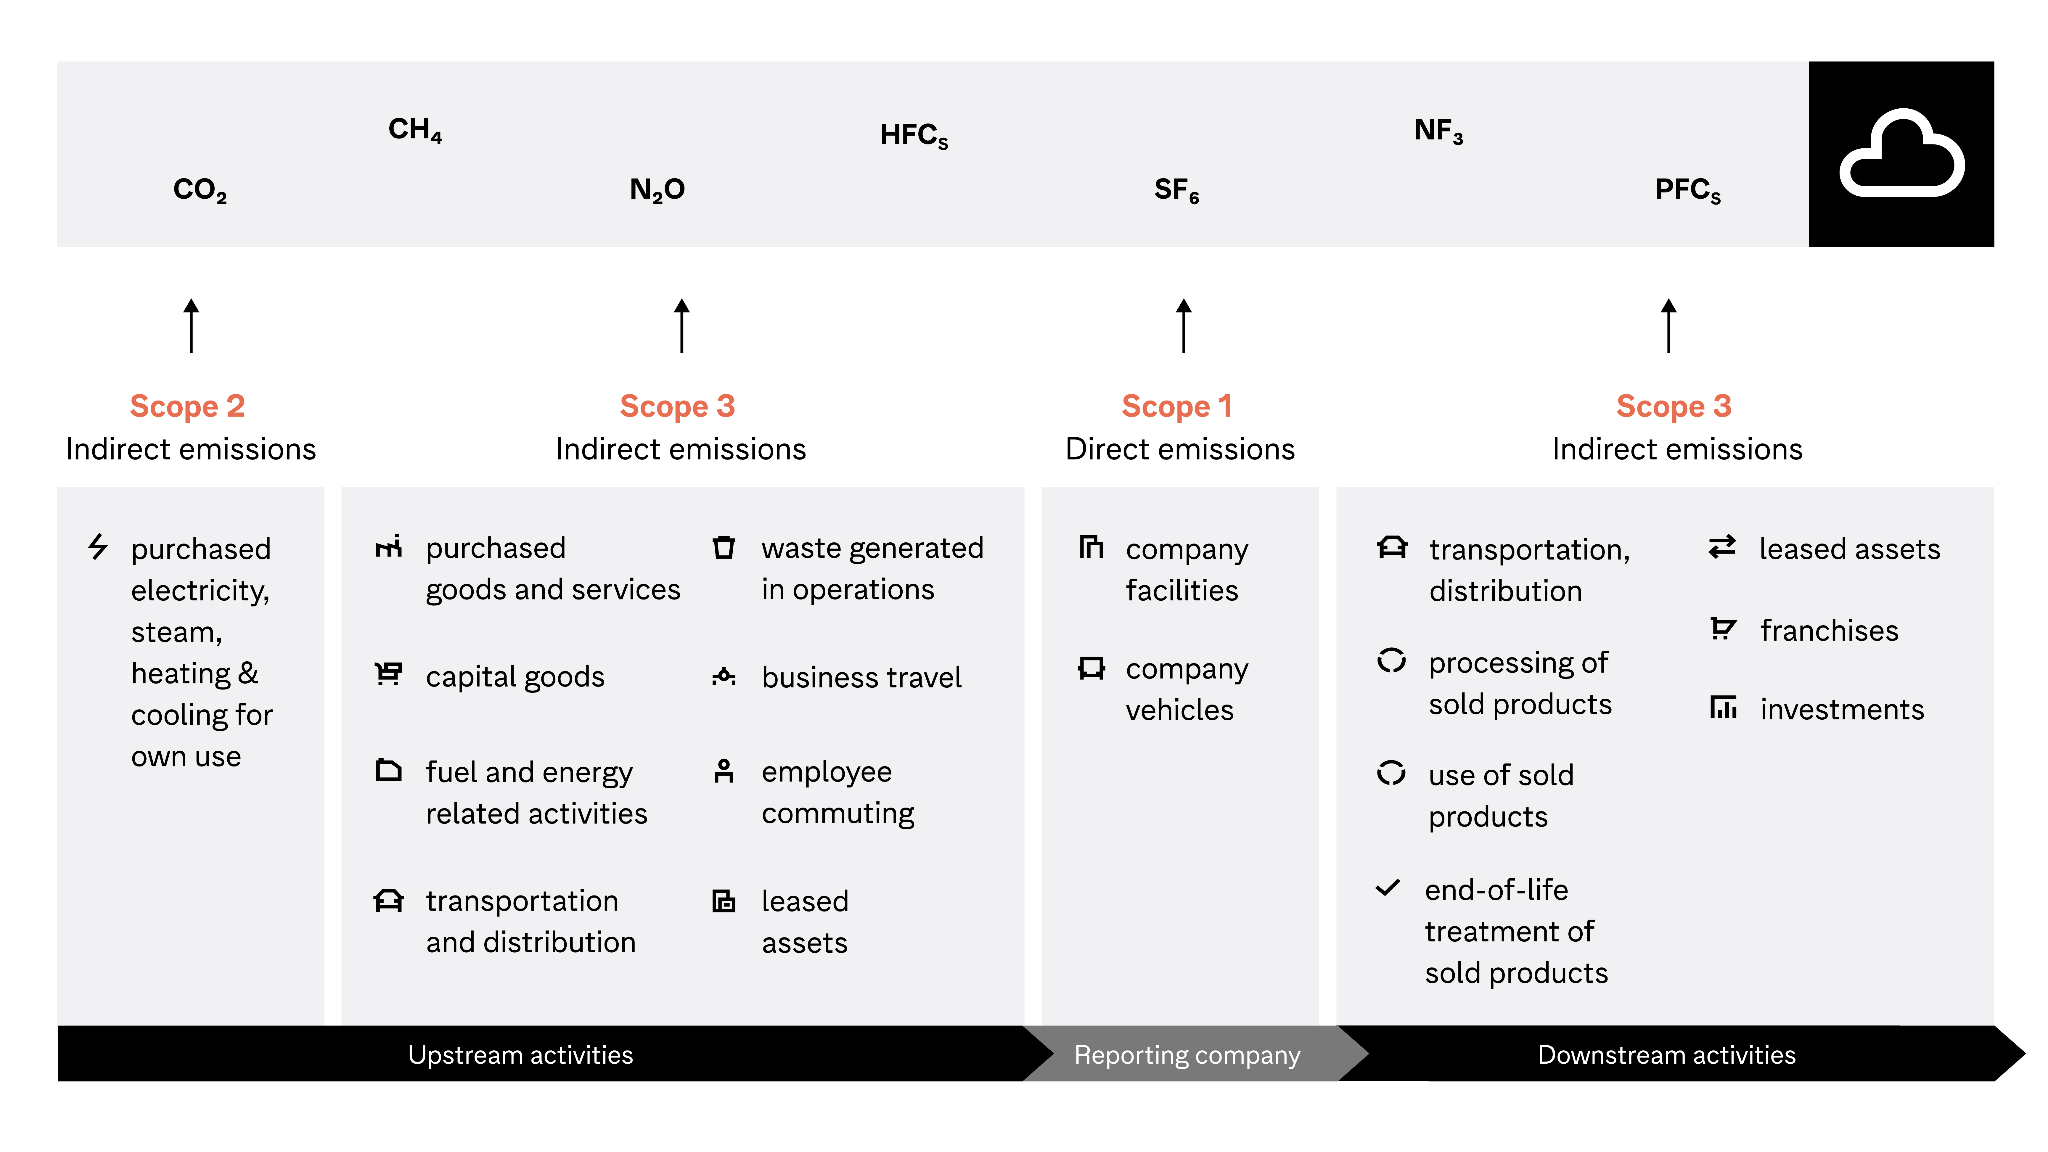
Examples of Scope 3 activities are:
- Purchased
goods (e.g., raw materials, office supplies)
- Employee
commutes and business travel
- Waste
disposal
- How
customers use your products
If you’ve ever wondered, “Why is our carbon footprint so
high despite going solar?”, Scope 3 is likely the culprit.

Before focusing on the most relevant categories for your
business, it’s essential to understand the full spectrum of Scope 3
emissions as defined by the GHG Protocol. These 15 categories cover
every indirect emission source in your value chain—from raw materials to
product disposal.
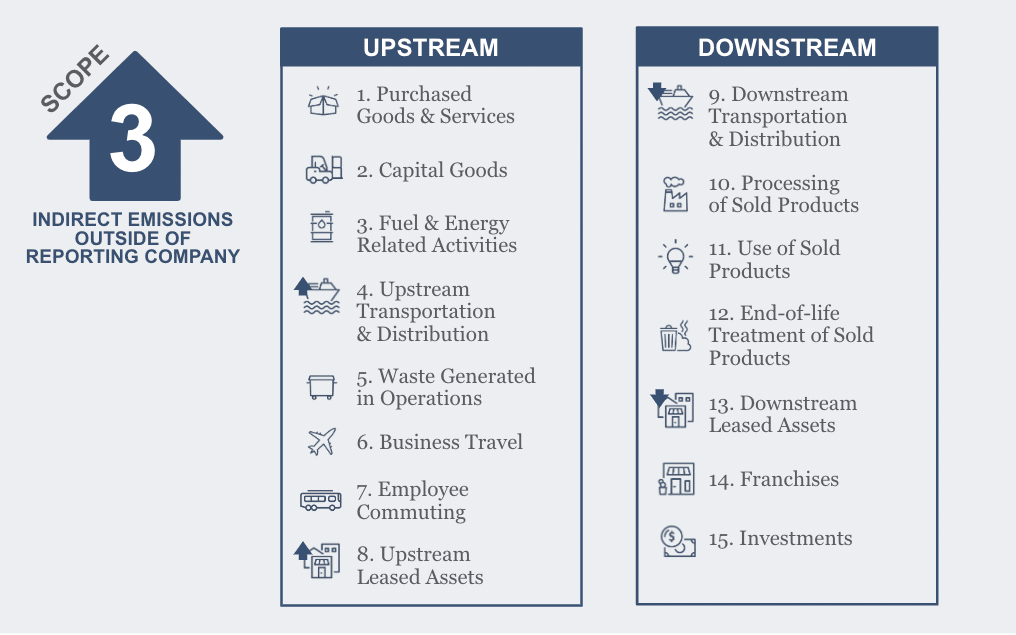
Here’s a breakdown of all categories, their significance, and real-world examples:
Upstream
Emissions (Your Supply Chain)
1. Purchased Goods & Services
- What
it includes: Emissions from producing materials, components, and services
you buy.
- Examples:
- Office
supplies (paper, laptops)
- Raw
materials (steel, cotton, plastic)
- Outsourced
services (accounting, marketing)
- Why
it matters: Often the largest Scope 3 category for manufacturers
and retailers.
2. Capital Goods
- What
it includes: Emissions from manufacturing long-term assets (equipment,
machinery, buildings).
- Examples:
- Factory
machines
- Company
vehicles
- IT
servers
- Why
it matters: Significant for industries with heavy machinery (construction,
tech).
3. Fuel- & Energy-Related Activities (Not in Scope
1/2)
- What
it includes: Emissions from producing fuels/electricity you buy (even if
you don’t burn them).
- Examples:
- Extraction
of natural gas for your boilers eg. methane
- Losses
in electricity transmission like heat in power lines
o Diesel
burned by pipelines transporting natural gas to your facility
- Why
it matters: Often overlooked but adds 5–15% to energy
footprints.
4. Upstream Transportation & Distribution
- What
it includes: Emissions from shipping goods to you (by suppliers or
logistics partners).
- Examples:
- Freight
trucks delivering raw materials
- Air
shipping for urgent orders
- Why
it matters: Critical for e-commerce and global supply chains
5. Waste Generated in Operations
- What
it includes: Emissions from disposing of your waste (landfill, recycling,
incineration).
- Examples:
- Food
waste from cafeterias
- Packaging
trimmings
- Why
it matters: Landfill waste emits methane (25x worse than CO₂).
6. Business Travel
- What
it includes: Employee travel (flights, trains, hotels).
- Examples:
- Sales
team flights
- Hotel
stays for conferences
- Why
it matters: A major emissions source for consulting firms and
multinationals.
7. Employee Commuting
- What
it includes: Daily travel to/from work (cars, buses, bikes).
- Examples:
- Gasoline
cars (high emissions)
- Electric
trains (low emissions)
- Why
it matters: Hybrid work has reduced this, but it’s still significant for
offices.
8. Upstream Leased Assets
- What
it includes: Emissions from assets you lease (and don’t own).
- Examples:
- Leased
warehouses
- Rented
company cars
- Why
it matters: Often missed in carbon accounting.
9. Downstream Transportation & Distribution
- What
it includes: Emissions from shipping products to customers.
- Examples:
- Amazon
delivery trucks
- Air
freight for luxury goods
- Why
it matters: E-commerce giants like Shopify track this closely.
10. Processing of Sold Products
- What
it includes: Emissions when customers process your goods (e.g., refining,
cooking).
- Examples:
- A
steel mill’s emissions when making your metal into cars
- A
bakery baking your flour into bread
- Why
it matters: Key for B2B companies selling raw materials.
- What
it includes: Emissions when customers use your product.
- Examples:
- Gasoline
burned in cars you sell
- Electricity
used by your smartphones
- Why
it matters: The #1 category for automakers and electronics
firms.
12. End-of-Life Treatment of Sold Products
- What
it includes: Emissions from disposing/recycling your products.
- Examples:
- Landfilled
plastic packaging
- Recycled
iPhones
- Why
it matters: Fast fashion and tech companies face scrutiny here.
13. Downstream Leased Assets
- What
it includes: Emissions from assets you lease to others (e.g., rental
cars).
- Examples:
- Hertz’s
rental car fleet, Grab’s taxis rented to drivers
- Leased
medical equipment
- Why
it matters: Growing focus in the sharing economy.
14. Franchises
- What
it includes: Emissions from franchisees using your brand.
- Examples:
- McDonald’s
franchise locations
- 7-Eleven
stores
- Why
it matters: Major for global franchises.
- What
it includes: Emissions from companies you invest in.
- Examples:
- A
bank’s carbon footprint from oil/gas loans
- Venture
capital funds backing startups
- Why
it matters: Critical for ESG investors.
Which Categories Should Your Business Prioritize?
|
Industry |
Top 3-5 Categories to Focus On |
|
Manufacturing |
1 (Purchased goods), 4 (Upstream transport), 11 (Product
use) |
|
Retail/E-commerce |
1, 9 (Downstream transport), 12 (Packaging waste) |
|
Tech/Software |
1, 6 (Business travel), 11 (Data center energy use) |
|
Professional Services |
6, 7 (Commuting), 1 (Office supplies) |
Key Takeaways
- Scope
3 is vast—but you don’t need to track all 15 categories at once.
- Start
with high-impact areas (e.g., purchased goods, business travel).
- Use
estimates where data is lacking—it’s better than ignoring them!
Next Step: Choose a calculation method based on
your priority categories.

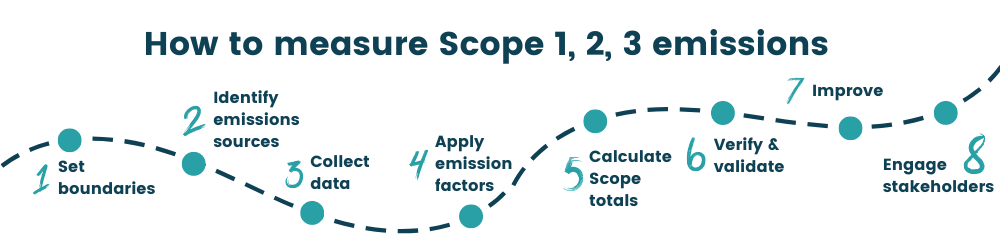
Step 2:
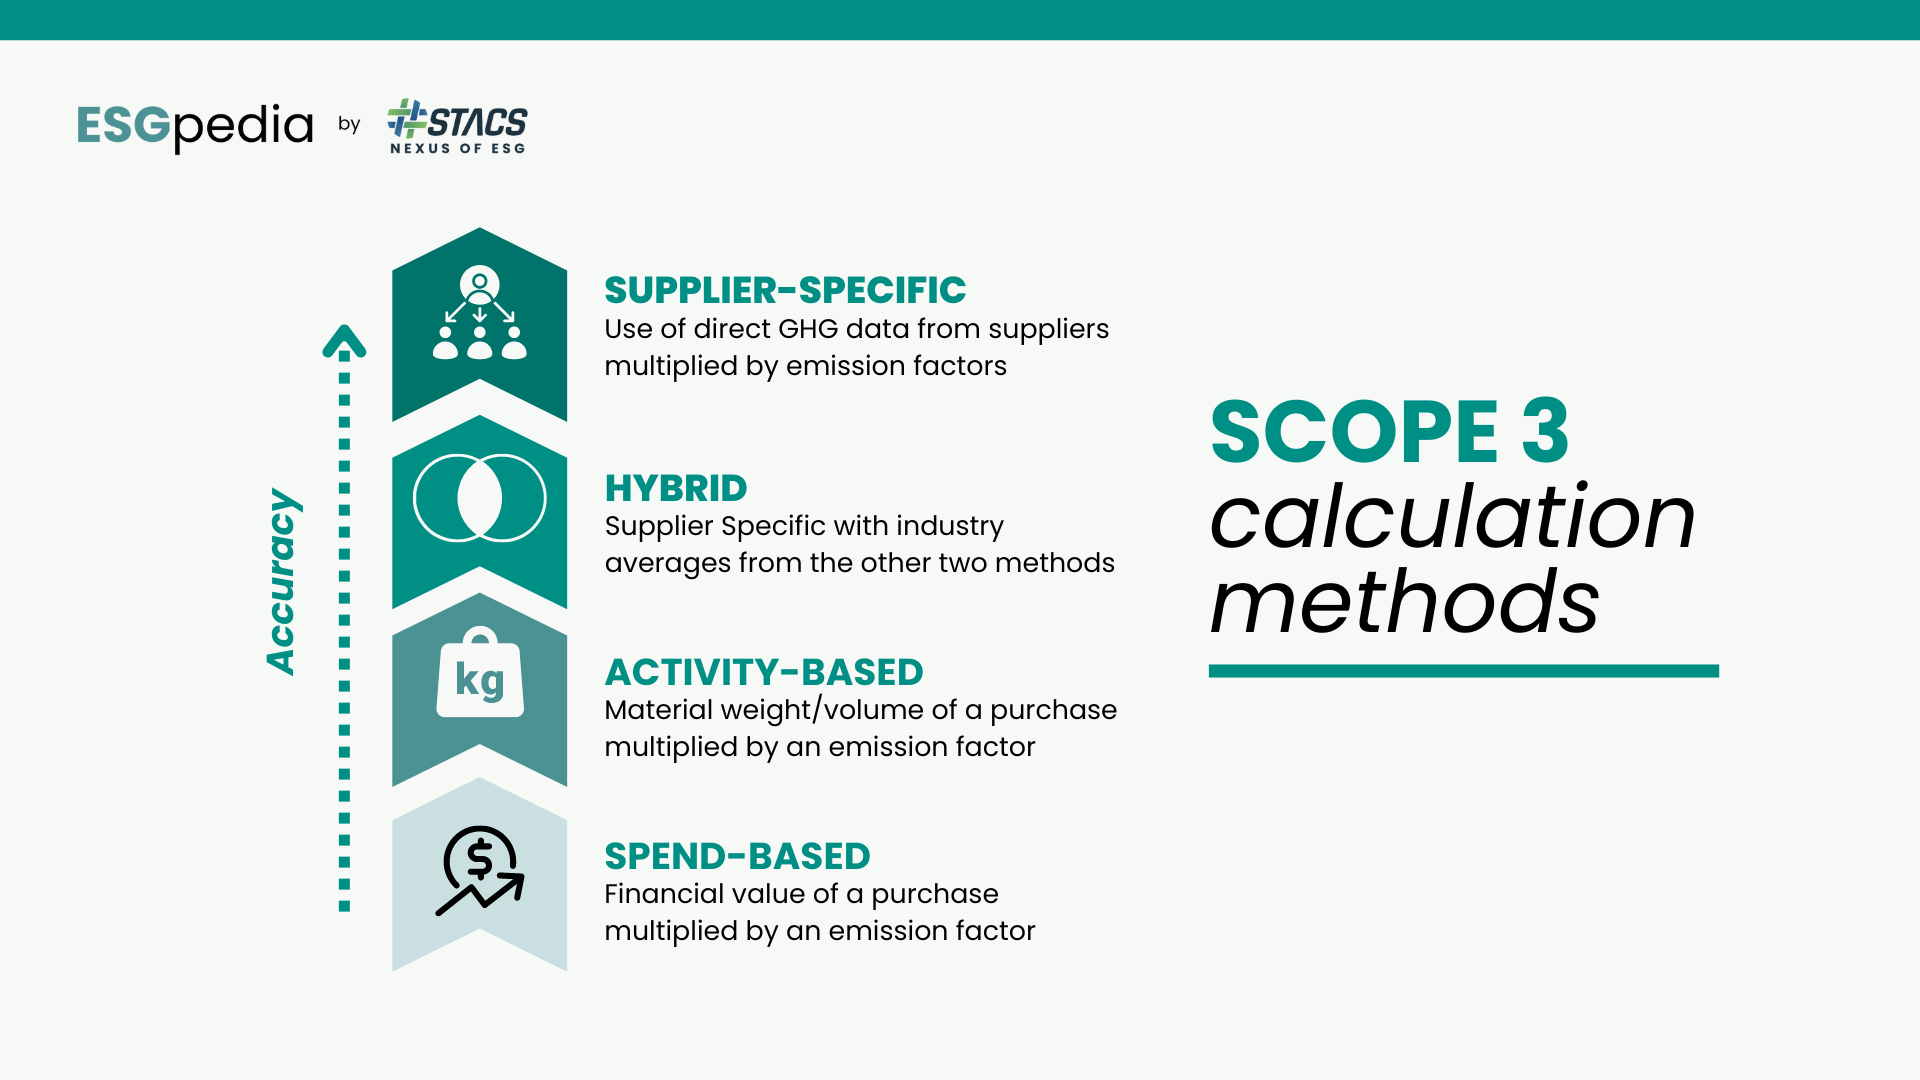
Choosing a Scope 3 Calculation Method
Calculating Scope 3 emissions requires selecting the right
method based on data availability and accuracy needs. Below, we
explain the three primary approaches, their formulas, and real-world examples
to help you decide which is best for your business.
1.
Spend-Based Method (Simplest)
What It Is
Estimates emissions using financial spending
data multiplied by industry-average emission factors (per dollar
spent).
When to Use It
✔ Small businesses with limited
supplier data
✔ Quick initial assessments
✔ Low-priority categories (e.g., office supplies)
Formula
Emissions (kg CO₂e) =
Money Spent ($) × Emission Factor (kg CO₂e/$)
Example
- Activity:
Spent $50,000 on laptops last year.
- Emission
Factor: 0.5 kg CO₂e per $1 spent on electronics (from EPA EEIO).
- Calculation:
$50,000 × 0.5 kg CO₂e/$ = 25,000 kg CO₂e (25 metric tons)
Pros
& Cons
|
Pros |
Cons |
|
✅ Fast, low-effort |
❌ Less accurate (uses averages) |
|
✅ No supplier engagement needed |
❌ Misses supplier-specific
efforts (e.g., renewable |
2. Hybrid
Method (Balanced Approach)
What It Is
Combines supplier-specific data (where available) with spend-based
estimates for the rest.
When to Use It
✔ Mid-sized businesses with some
supplier collaboration
✔ High-impact categories (e.g., raw materials)
Formula
Total Emissions=(∑Supplier-Specific Data) + (∑Spend-Based Estimates)
Example
- Activity:
Purchased $200,000 worth of steel last year.
- Supplier
A (provides carbon data): 100 tons steel × 1.85 kg CO₂e/kg
= 185,000 kg CO₂e.
- Supplier
B (no data): $100,000 × 0.3 kg CO₂e/$ (industry avg.) = 30,000
kg CO₂e.
- Total:
185,000 kg + 30,000 kg = 215,000 kg CO₂e (215 metric tons)
Pros & Cons
|
Pros |
Cons |
|
✅ More accurate than
spend-based |
❌ Requires supplier engagement |
|
✅ Flexible for partial data |
❌ Still uses estimates for gaps |
3.
Physical Unit Method (Most Accurate)
What It Is
Calculates emissions using actual quantities (kg,
liters, km) multiplied by physical emission factors.
When to Use It
✔ Large companies with detailed
supplier data
✔ High-stakes categories (e.g., product lifecycles)
Formula
Emissions (kg CO₂e)=Quantity Used×Emission Factor (kg CO₂e/unit)
Example
- Activity:
Shipped 10,000 kg of goods via air freight.
- Emission
Factor: 8.5 kg CO₂e/kg of air freight (from DEFRA).
- Calculation:
10,000 kg × 8.5 kg CO₂e/kg = 85,000 kg CO₂e (85 metric tons)
Pros
& Cons
|
Pros |
Cons |
|
✅ Highest accuracy |
❌ Requires granular data |
|
✅ Recognized by auditors |
❌ Time-intensive to collect |
How to
Choose the Right Method
|
Factor |
Spend-Based |
Hybrid |
Physical Units |
|
Effort Required |
Low |
Medium |
High |
|
Data Needs |
Only $ spent |
Partial supplier data |
Full supplier data |
|
Best For |
SMEs, early stages |
Growing businesses |
Large enterprises |
Real-World Example: Patagonia’s Hybrid Approach
- Spend-based:
Used for low-impact items (e.g., office supplies).
- Physical
units: Tracked cotton, nylon, and freight emissions per kg.
- Result:
Identified that 83% of emissions came from raw materials, leading to
a switch to organic cotton.
Step 3:
Finding Emission Factors for Scope 3 – The Ultimate Guide
Emission factors (EFs) are the "conversion rates" that turn your business activities (like shipping goods or buying materials) into measurable carbon emissions. Choosing the right factors is critical for accurate Scope 3 accounting.

1. Types
of Scope 3 Emission Factors
A. Spend-Based Factors
- What
they do: Convert dollars spent into CO₂e (kg CO₂e per $1).
- Best
for: Categories like purchased goods/services (Category 1), capital goods
(Category 2).
- Sources:
- EPA's EEIO Database (U.S.-specific)
- EXIOBASE (global,
multi-regional)
Example:
- 100,000spentonmarketingservices×0.2kgCO2e/ (EEIO
factor) = 20,000 kg CO₂e
B. Physical Unit Factors
- What
they do: Convert measurable units (kg, km, kWh) into CO₂e.
- Best
for: Transportation, material use, energy.
- Sources:
- DEFRA UK (transport, materials)
- Ecoinvent (paid,
but gold-standard for LCAs)
- IPCC
Emission Factor Database
Example:
- 10,000
kg of steel purchased × 1.85 kg CO₂e/kg = 18,500 kg CO₂e
C. Activity-Specific Factors
Specialized factors for common business activities:
|
Activity |
Sample Factor |
Source |
|
Air travel (economy) |
0.15 kg CO₂e/passenger-km |
DEFRA |
|
Sea freight |
0.01 kg CO₂e/tonne-km |
GLEC Framework |
|
Landfill waste |
0.1 kg CO₂e/kg |
EPA WARM Model |
|
Employee commuting |
0.2 kg CO₂e/km (gasoline car) |
DEFRA |
2. Where
to Find Reliable Factors
Free Databases
- General
Materials & Services
- EPA EEIO (U.S. $→CO₂e)
- European
Commission EF Database
- Transportation
- DEFRA UK (air, road, rail)
- GLEC
Framework (freight-specific)
- Energy
& Waste
- EPA WARM Model (waste
emissions)
- IEA Country Factors (electricity
by nation)
Paid Databases (More Detailed)
- Ecoinvent:
~$2,000/year but covers 10,000+ materials
- GaBi:
Popular for product lifecycles
- SimaPro:
Used by Fortune 500s for LCAs
3. How to
Select the Right Factor
Follow this decision tree:
- Is
supplier-specific data available?
- Yes
→ Use their reported factor (most accurate)
- No
→ Proceed to step 2
- Can
you measure physical units (kg, km, kWh)?
- Yes
→ Use physical unit factors (e.g., DEFRA for transport)
- No
→ Use spend-based factors (e.g., EPA EEIO)
- Does
the factor match your region/year?
- Always
prefer localized and recent factors (e.g., 2023 U.S.
factors vs. 2015 global averages)
4. Applying Factors Correctly
Example 1: Shipping Goods (Physical Units)
- Activity:
5,000 kg shipped 500 km by truck
- Factor:
0.1 kg CO₂e/tonne-km (from GLEC)
- Calculation:
5 tonnes × 500 km×0.1 kg CO₂e/tonne-km=250 kg CO₂e
- Activity:
10 employees fly 2,000 km each (economy)
- Factor:
0.15 kg CO₂e/passenger-km (DEFRA)
- Calculation:
10×2,000×0.15=3,000 kg CO₂e (3 metric tons)
Example 3: Purchased Goods (Spend-Based)
- Activity:
$200,000 spent on plastic components
- Factor:
0.4 kg CO₂e/$ (EPA EEIO for plastics manufacturing)
- Calculation:
$200,000×0.4=80,000 kg CO₂e (80 metric tons)
Real-World Example: IKEA's Approach
- Uses physical
unit factors for wood, cotton, and transport.
- Uses spend-based for
low-impact items like office supplies.
- Publishes
all factors in their Sustainability Report for transparency.
Step 4:
Collecting Scope 3 Data
Collecting data for Scope 3 emissions can feel overwhelming,
but it doesn’t have to be. Here’s how to gather what you need without
losing your mind, prioritized by feasibility and impact.
1. Start With the "Big Rocks" (Highest-Impact Categories)
Focus on 3-5 categories that typically
contribute 80% of Scope 3 emissions for your industry:
|
Industry |
Top Categories to Prioritize |
Where to Find Data |
|
Manufacturing |
1 (Purchased goods), 4 (Transport), 11 (Product use) |
Supplier invoices, logistics records |
|
Retail/E-commerce |
1, 9 (Downstream transport), 12 (Packaging waste) |
Procurement spend, shipping contracts |
|
Tech/Office-Based |
6 (Business travel), 7 (Commuting), 1 (IT hardware) |
Expense reports, HR surveys |
Pro Tip: Use the Pareto Principle – 20% of
effort will cover 80% of your footprint.
2. Data Collection Strategies by Category
A. Purchased Goods & Services (Category 1)
Low-Effort Approach (Spend-Based):
- Pull annual
spend data by category from accounting software (QuickBooks, SAP).
- Apply EPA
EEIO factors (kg CO₂e per $ spent).
Example:
- $500,000
spent on "electronic equipment" × 0.3 kg CO₂e/$ = 150,000
kg CO₂e.
Higher-Accuracy Approach:
- Ask top
5 suppliers (by spend) for carbon data via a simple email:
"Hi [Supplier], as part of our sustainability
efforts, could you share the carbon footprint (kg CO₂e) per unit/product you
supply us? Even rough estimates help!"
B.
Business Travel (Category 6)
Automated Method:
- Use corporate
card data (Amex, Concur) or travel platforms (TripActions).
- Multiply flight
miles × DEFRA factors (e.g., 0.15 kg CO₂e/km for economy).
Manual Method (No Tech Tools):
- Sample 3
months of travel, extrapolate annually.
Example:
- 100
flights × 1,000 km × 0.15 kg CO₂e/km = 15,000 kg CO₂e.
C. Employee Commuting (Category 7)
Simple Survey Template:
1. How do you commute? (Car, bus, bike, etc.)
2. Average round-trip distance: ____ km/miles
3. Days worked onsite/week: ____
· Use DEFRA
factors (e.g., 0.2 kg CO₂e/km for gas cars).
Example:
· 50
employees × 20 km/day × 220 days × 0.2 kg CO₂e/km = 44,000 kg CO₂e.
D.
Transportation & Distribution (Categories 4 & 9)
For Logistics Partners:
- Request total
tonne-km shipped (weight × distance) from carriers.
- Apply GLEC
factors (e.g., 0.1 kg CO₂e/tonne-km for trucking).
No Partner Data? Estimate:
- #
of shipments/year × average distance × typical truck capacity.
Pro Tips to Avoid Burnout
✅ Start with 1-2
categories (e.g., travel + purchased goods).
✅ Use estimates for now – refine later (e.g., "60%
of shipments are by truck").
✅ Leverage existing reports (AP records, fuel cards,
utility bills).
✅ Set a time limit (e.g., "2 hours/week for 4
weeks").
Real-World
Example: How Patagonia Simplified
- Focused
first on cotton, nylon, and freight (biggest impacts).
- Used:
- Supplier
data for key materials
- Spend-based for
everything else
- Cut
data collection time by 70% while capturing 90% of emissions.
Step 5:
Calculating & Summing Scope 3 Emissions
Now that you’ve collected data and emission factors, it’s
time to crunch the numbers. Here’s how to calculate emissions for each category
and roll them up into a total Scope 3 footprint—without overcomplicating it.
1. The
Basic Calculation Formula
For each activity in your prioritized categories,
use:
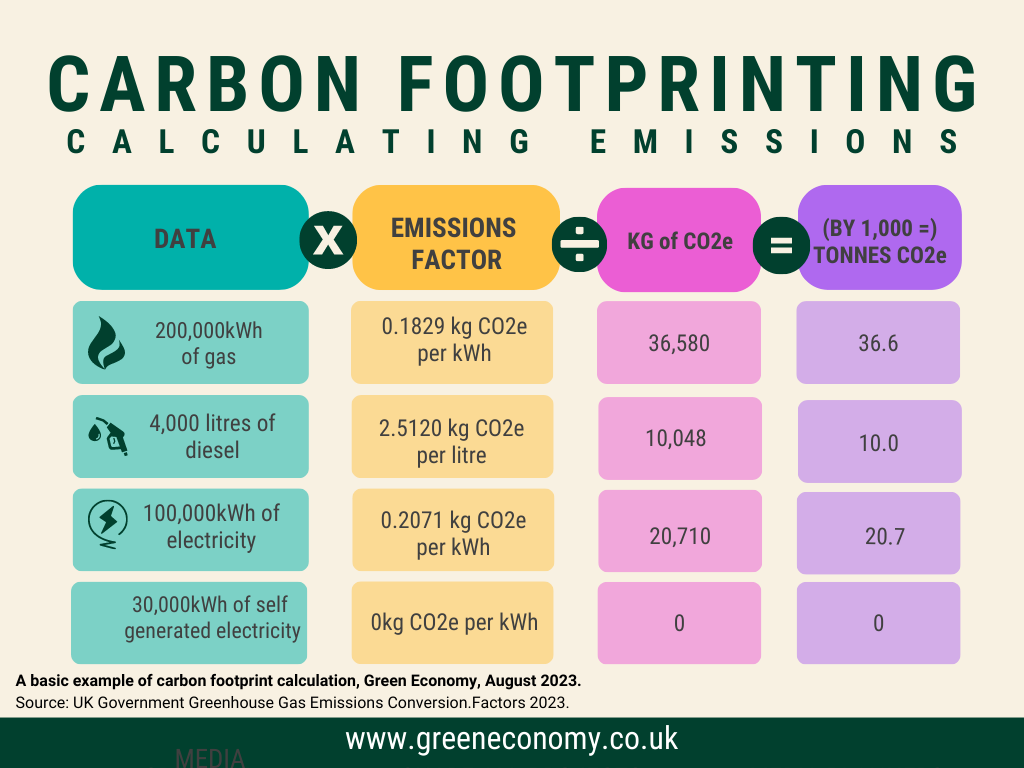
Emissions (kg CO₂e)=Activity Data × Emission Factor
Variables:
- Activity
Data: Quantity (kg, km, $) from Step 4.
- Emission
Factor: kg CO₂e per unit (from Step 3).
2.
Category-by-Category Examples
A. Purchased Goods (Category 1)
Method: Spend-based
- Data:
$200,000 spent on office furniture.
- Factor:
0.4 kg CO₂e/$ (EPA EEIO for "furniture manufacturing").
- Calculation:
$200,000 × 0.4 = 80,000 kg CO₂e (80 metric tons)
B. Business Travel (Category 6)
Method: Physical units
- Data:
50 flights × 1,500 km each (economy class).
- Factor:
0.15 kg CO₂e/km (DEFRA).
- Calculation:
50 × 1,500 × 0.15 = 11,250 kg CO₂e (11.25 metric tons)
C. Employee Commuting (Category 7)
Method: Hybrid
- Survey
Data:
- 30
employees drive 20 km/day × 220 days/year = 132,000 km.
- 20
employees take trains (10,000 km total).
- Factors:
- Car:
0.2 kg CO₂e/km (gasoline).
- Train:
0.05 kg CO₂e/km (DEFRA).
- Calculation:
(132,000×0.2) + (10,000×0.05 )= 26,400 + 500 = 26,900 kg CO₂e
Summing All Categories
Create a master table to tally your total Scope 3 emissions:
|
Category |
Emissions (kg CO₂e) |
Notes |
|
1. Purchased goods |
80,000 |
Spend-based estimate |
|
6. Business travel |
11,250 |
Flight distances × DEFRA |
|
7. Employee commuting |
26,900 |
Survey data × transport modes |
|
Total Scope 3 |
118,150 (118.15 t) |

Handling Partial Data
Don’t have full-year data? Use:
- Sampling:
Calculate 1 month × 12 (adjust for seasonality).
- Proxies:
If missing a facility, apply data from a similar one.
Example:
- Only
have Q1 shipping data? Assume Q1 = 25% of annual volume.
Real-World Example: Microsoft’s Approach
- Physical
units for high-impact categories (e.g., cloud hardware).
- Spend-based for
low-priority spend (e.g., office supplies).
- Total
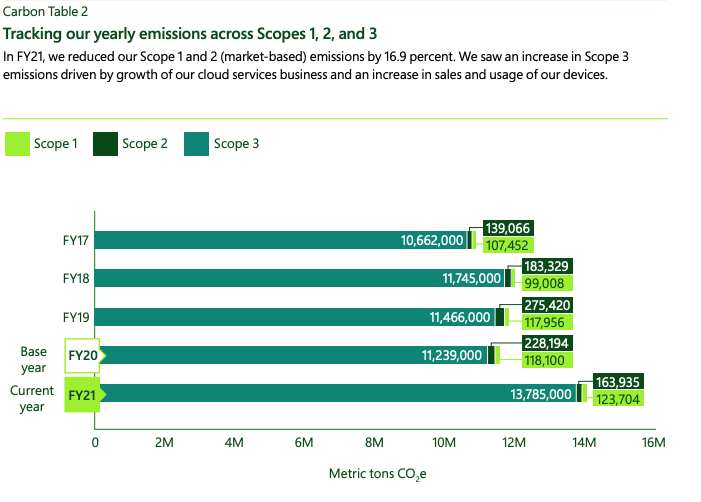
Scope 3 (2023): 15.3 million metric tons (78% of total footprint).
Calculating Scope 3 emissions isn’t just a compliance exercise—it’s a strategic superpower. By following this guide, you’ve learned how to:
- Identify
your high-impact categories (like purchased goods, travel, and
logistics).
- Gather
data without perfectionism (using spend-based estimates, surveys, and
sampling).
- Apply
the right emission factors (from trusted sources like EPA, DEFRA, or
suppliers).
- Calculate
and sum emissions to see your total value chain footprint.
Do remember, you can:
1.
Start small, improve yearly: Even rough
estimates are better than nothing.
2.
Engage suppliers: Simple emails can yield carbon
data for your biggest spends.
3.
Set reduction goals: Align with
the Science-Based Targets initiative (SBTi) for credibility.
"Scope 3 is where the real carbon footprint hides—and
where the most impactful changes happen."
You’ve now got the tools to measure it. The next step?
Reduce it. Whether through supplier partnerships, cleaner logistics, or product
redesign, your Scope 3 work will separate the leaders from the laggards.


Comments
Post a Comment